
Reference : Wheels & Deals: Regression Modeling for Cars
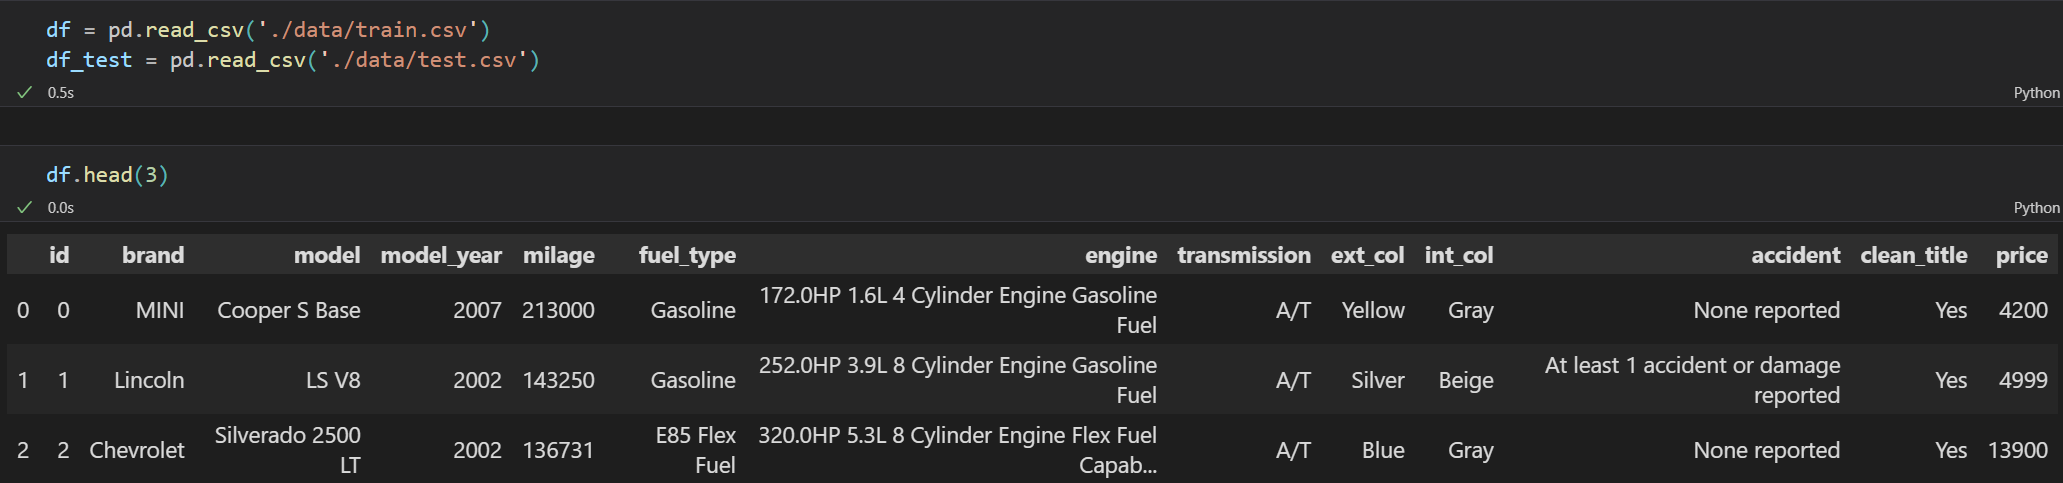
주어진 데이터를 기반으로 price를 예측하는 regression 문제입니다.
데이터 분석 및 추출 방법을 분석해봤습니다
EDA
Basic EDA
plt.figure(figsize = (14,6))
sns.heatmap(df.isnull(), cbar=False, cmap='viridis')
plt.title('Heatmap of Missing Values in Training Data')
plt.show()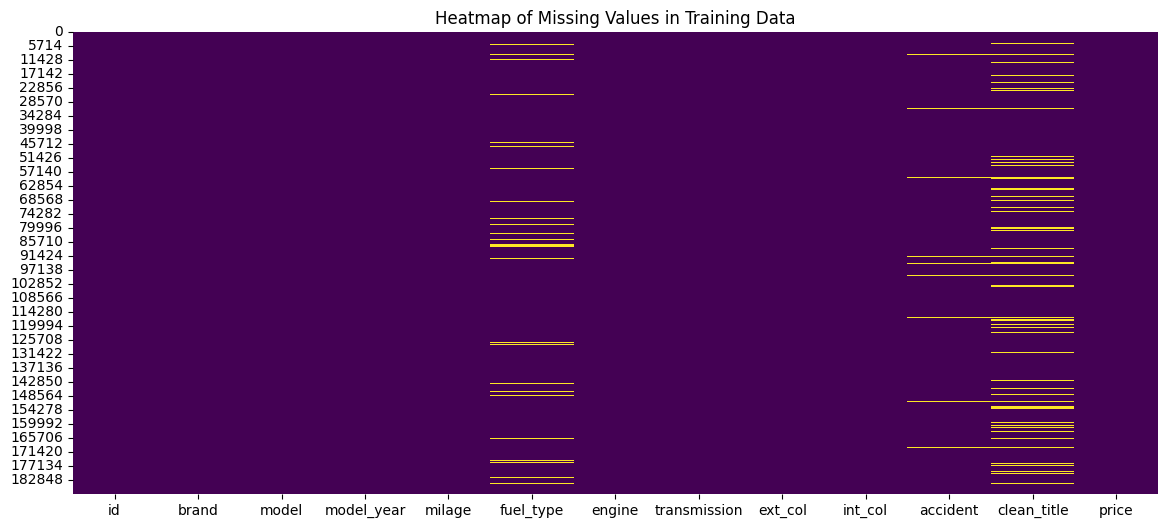
Visualization
columns = {'int64' : [], 'object' : []}
for col, typ in df.dtypes.items():
    columns[str(typ)].append(col)

columns['int64'].remove('id')
columns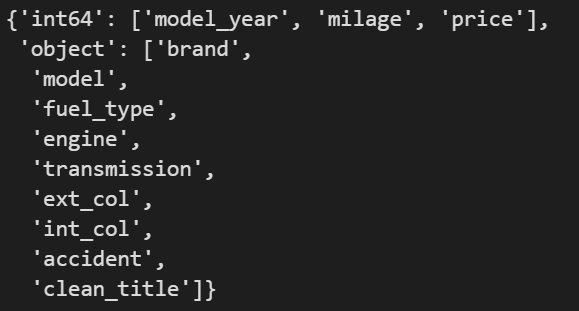
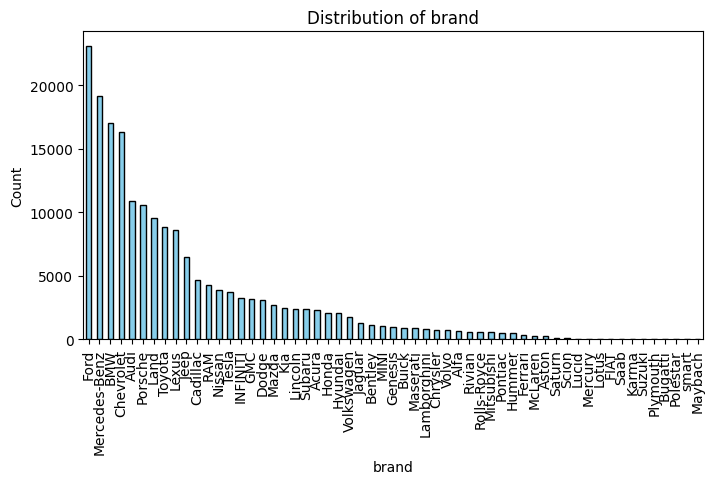
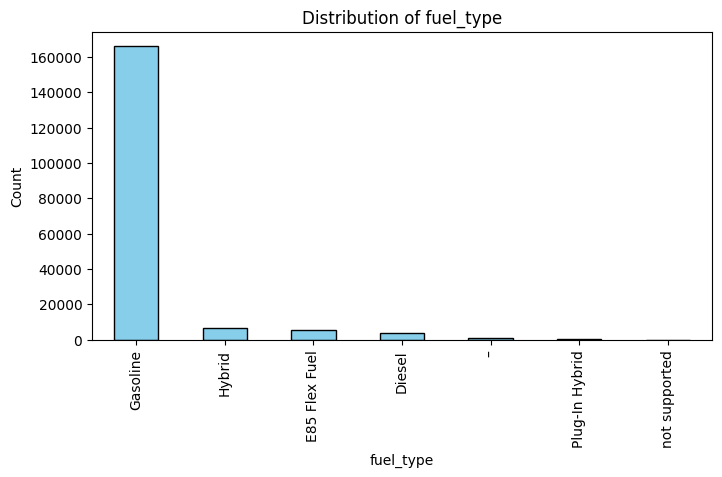
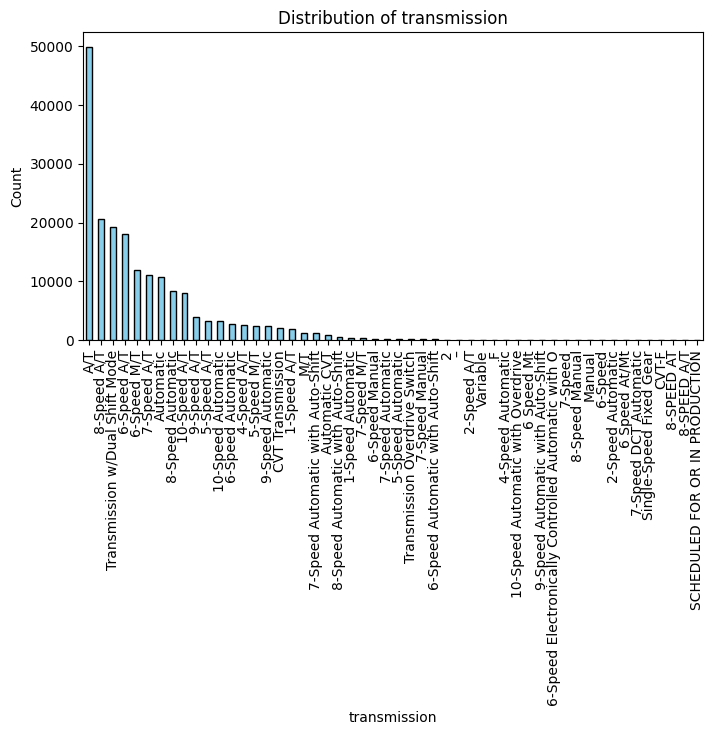
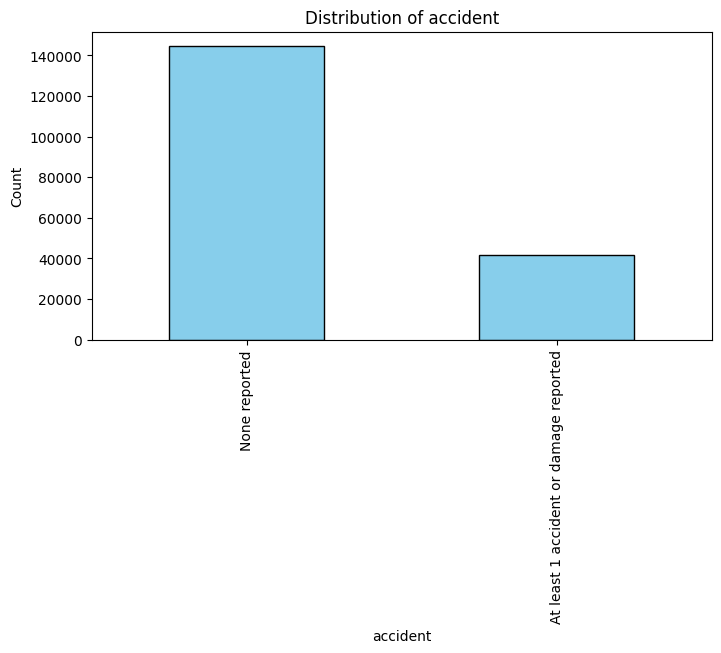
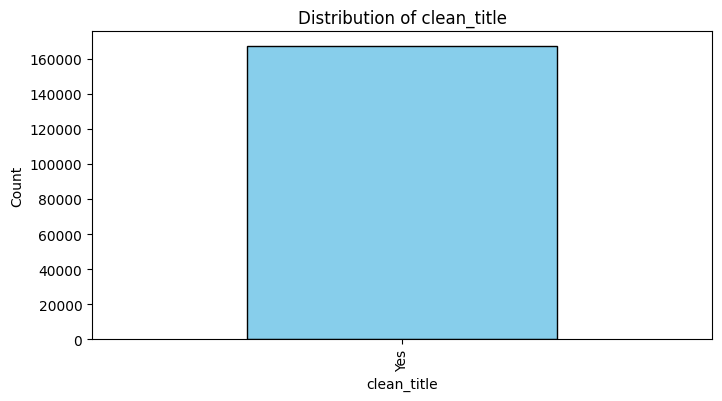
categorical_columns = ['brand', 'fuel_type', 'transmission', 'accident', 'clean_title']

for col in categorical_columns:
    plt.figure(figsize=(8, 4))
    df[col].value_counts().plot(kind='bar', color='skyblue', edgecolor='black')
    plt.title(f'Distribution of {col}')
    plt.xlabel(col)
    plt.ylabel('Count')
    plt.show()
Feature Engineering
import re

def extract_engine_info(engine_str):
    hp_match = re.search(r'(\d+\.?\d*)HP', engine_str)
    engine_size_match = re.search(r'(\d+\.?\d*)L', engine_str)
    cylinders_match = re.search(r'(\d+)\sCylinder', engine_str)

    hp = float(hp_match.group(1)) if hp_match else None
    engine_size = float(engine_size_match.group(1)) if engine_size_match else None
    cylinders = int(cylinders_match.group(1)) if cylinders_match else None

    return hp, engine_size, cylinders

df[['hp', 'engine_size', 'cylinders']] = df['engine'].apply(lambda x: pd.Series(extract_engine_info(x)))
df_test[['hp', 'engine_size', 'cylinders']] = df_test['engine'].apply(lambda x: pd.Series(extract_engine_info(x)))

df.head(3)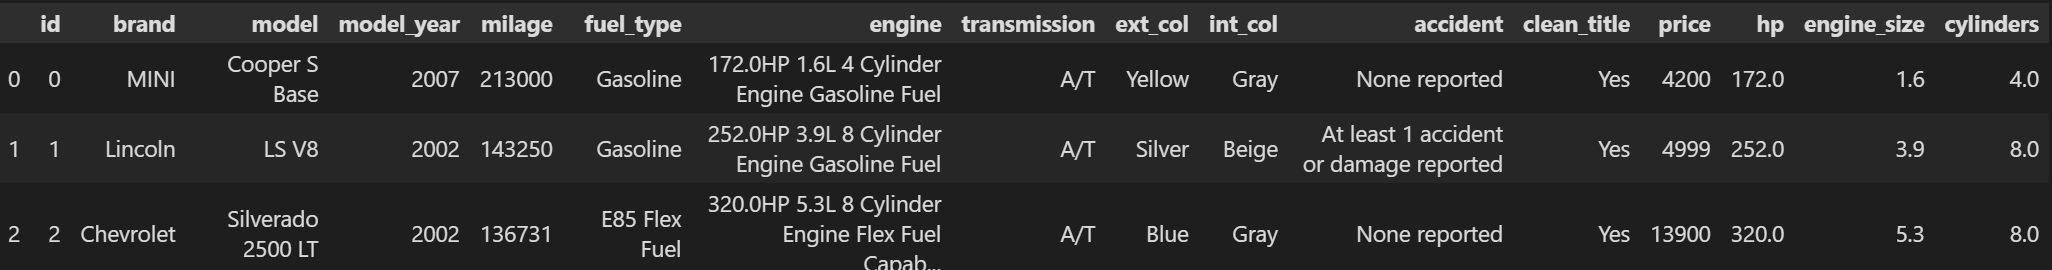
format이 정해진 문자열을 가진 engine에서 마력, 엔진크기, 실린더 수를 추출해내기 위해 Regex를 이용하여 각 값을 새로운 feature에 넣는다
\d+ : 숫자가 1번 이상 있다
\.? : 소수점(.)이 0번 또는 1번 있을 수 있다
\d* : 숫자가 0번 이상 있다
\s : 공백 문자를 찾는다
df[['model_main', 'model_trim']] = df['model'].str.split(' ', n=1, expand=True)
df_test[['model_main', 'model_trim']] = df['model'].str.split(' ', n=1, expand=True)
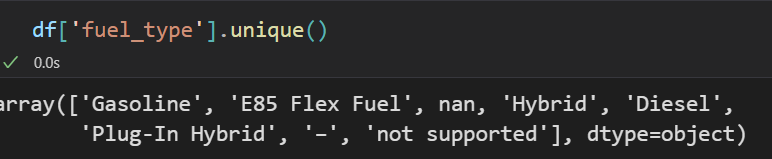
df['fuel_type'] = df['fuel_type'].replace(['–', 'not supported', np.nan], 'Unknown')
df_test['fuel_type'] = df['fuel_type'].replace(['–', 'not supported', np.nan], 'Unknown')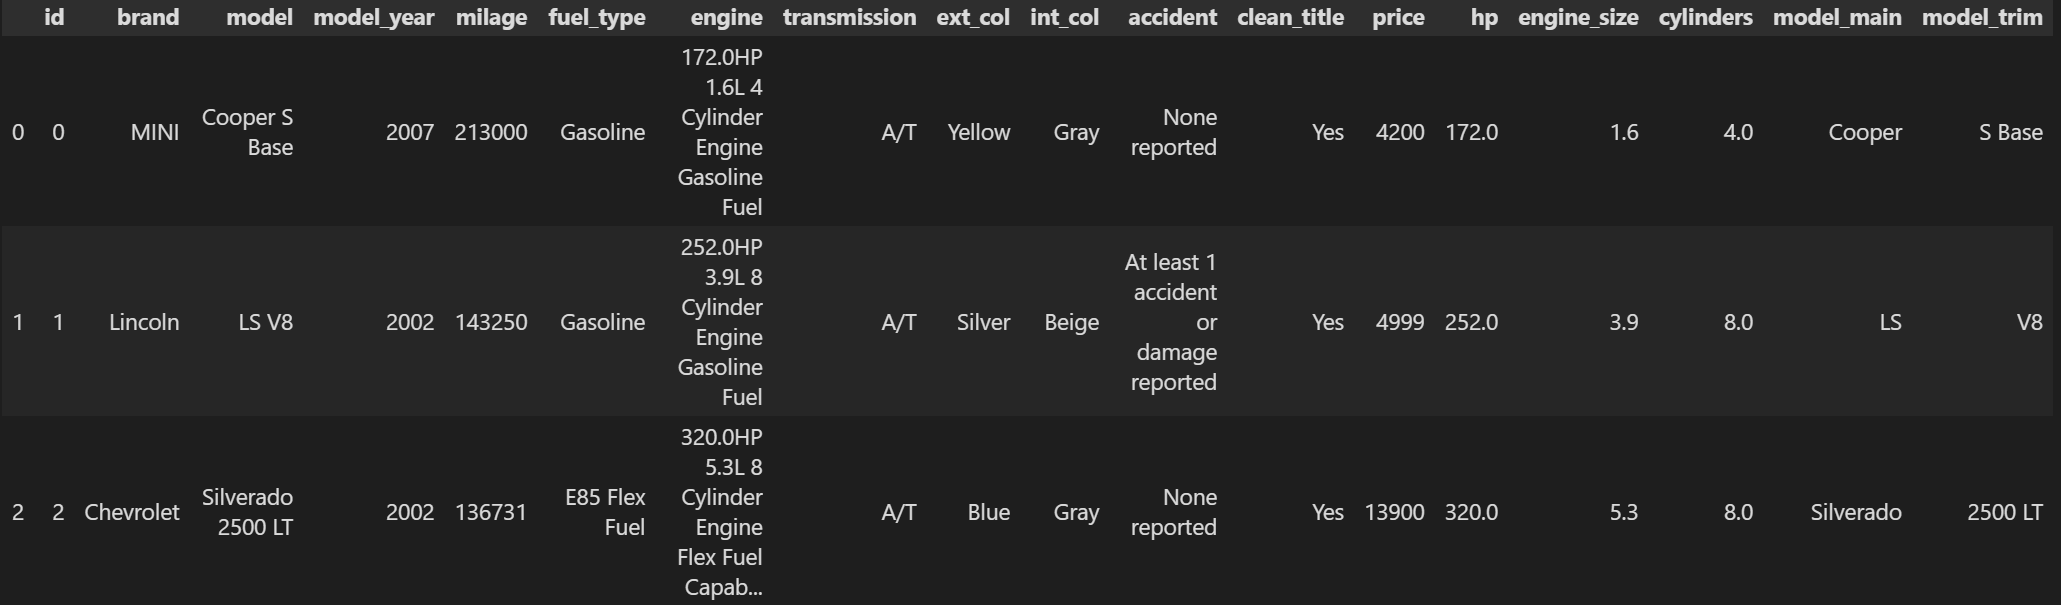
'model' 에서 앞과 뒤를 나누어 메인/트림으로 구분한다
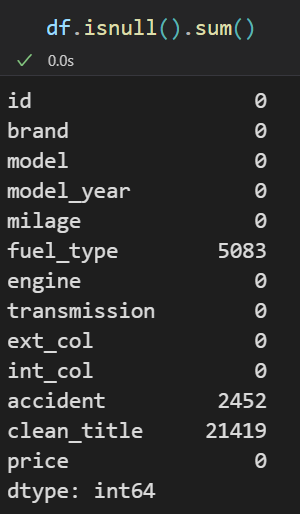
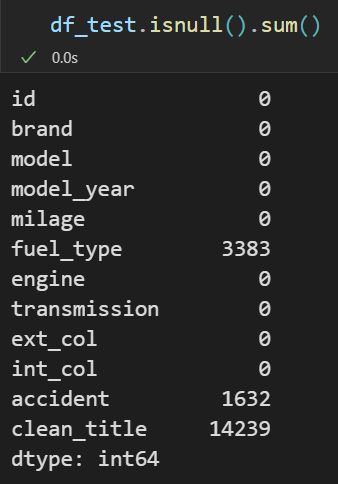
앞서 확인한 비어있는 fuel type을 Unknown으로 통합시킨다
threshold = 1000
brand_counts = df['brand'].value_counts()
test_brand_counts = df_test['brand'].value_counts()
rare_brands = brand_counts[brand_counts < threshold].index
test_rare_brands = test_brand_counts[test_brand_counts < threshold].index
df['brand'] = np.where(df['brand'].isin(rare_brands), 'Other', df['brand'])
df_test['brand'] = np.where(df_test['brand'].isin(test_rare_brands), 'Other', df_test['brand'])
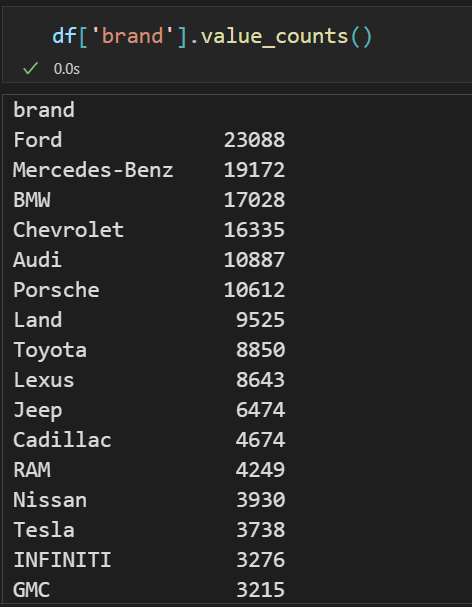
print(df['brand'].value_counts())
print(df_test['brand'].value_counts())
###
brand
Ford 23088
Mercedes-Benz 19172
BMW 17028
Chevrolet 16335
Audi 10887
Porsche 10612
Other 9953
Land 9525
Toyota 8850
Lexus 8643
Jeep 6474
Cadillac 4674
RAM 4249
Nissan 3930
Tesla 3738
INFINITI 3276
GMC 3215
Dodge 3133
Mazda 2719
Kia 2497
Lincoln 2423
Subaru 2381
Acura 2282
Honda 2101
...
Honda 1436
Hyundai 1308
Volkswagen 1222
임의의 임계점을 설정하고 너무 적은 수의 데이터를 가지고 있는 brand feature를 other로 통합시킨다
df['transmission'] = df['transmission'].replace({
    'A/T': 'Automatic',
    'Automatic CVT': 'Automatic',
    'CVT Transmission': 'CVT',
    'M/T': 'Manual',
    '6 Speed At/Mt': 'Automatic',
    'SCHEDULED FOR OR IN PRODUCTION': np.nan
})

df['transmission'] = df['transmission'].replace(['–', '2', np.nan], 'Unknown')


df_test['transmission'] = df_test['transmission'].replace({
    'A/T': 'Automatic',
    'Automatic CVT': 'Automatic',
    'CVT Transmission': 'CVT',
    'M/T': 'Manual',
    '6 Speed At/Mt': 'Automatic',
    'SCHEDULED FOR OR IN PRODUCTION': np.nan
})

df_test['transmission'] = df_test['transmission'].replace(['–', '2', np.nan], 'Unknown')
transmission을 단순화시킨다
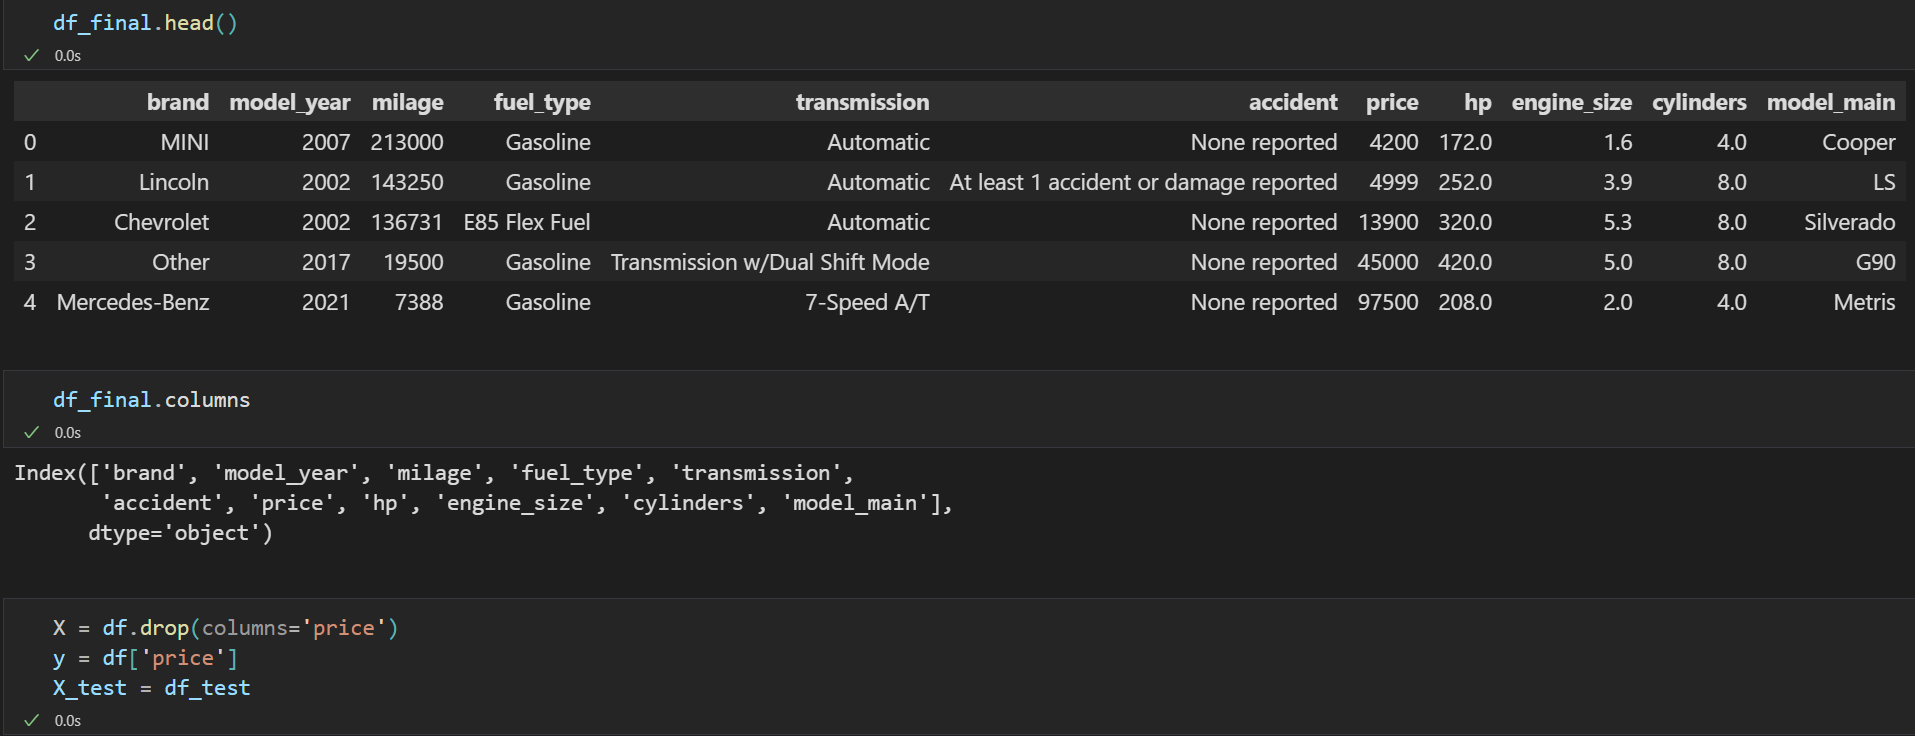
X / y 데이터가 준비되었습니다.
적절한 전처리 이후(스케일링, 결측치 대체, 원핫 인코딩 등) 모델을 훈련시킵니다.